Base House Info
This section will show you information on your as designed house. Reviewing this section carefully before selecting upgrades will help reduce sorting results on the Results Page.Code Metrics
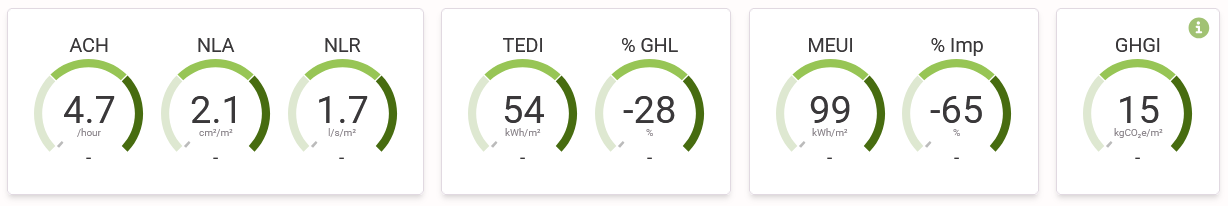
- Once your file has loaded the metrics selected by the Code Selector will appear.
- Each card represents a performance category.
- Each category may have multiple metrics applied.
- Each metric may have a difference performance level assigned to it.
- HEET will sap the highest possible performance to the left side to optimize your compliance pathway.
- If the levels between the metrics are the same, the value closest to the next level is chosen.
Where Your Home is Using Energy

- This chart breaks down where your home is using energy into 6 categories.
- HEET will give you additional details regarding the elements have the greatest effect on the category.
- Mousing over each of the the elements in the large bars will display the energy conservation measure and how much it is affecting the category.
- Categories with the largest energy use are a good place to start to improve your MEUI.
- Additional Baseloads and Lighting and Appliances are currently set by Hot2000 and cannot be changed in HEET.
- The smaller, lighter bars represent the Reference House.
- If you are using the Reference Metrics for compliance, you can compare the 2 bar graphs to identify which categories should be focused on to reduce the Base House heat loss to be lower than the Reference House heat loss.
- The number inside the pie chart shows the total annual energy consumption.
Where Your Home is Losing Heat
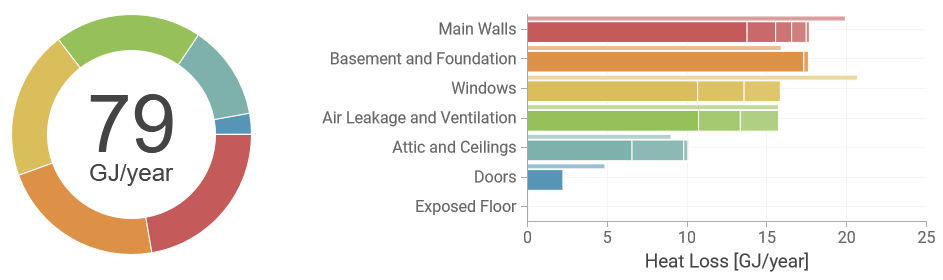
- This chart breaks down where your home is losing heat into 7 categories.
- HEET will give you additional details regarding the elements have the greatest effect on the category.
- Mousing over each of the the elements in the large bars will display the energy conservation measure and how much it is affecting the category.
- Categories with the largest heat loss are a good place to start to improve your TEDI.
- The smaller, lighter bars represent the Reference House.
- If you are using the Reference Metrics for compliance, you can compare the 2 bar graphs to identify which categories should be focused on to reduce the Base House heat loss to be lower than the Reference House heat loss.
- The number inside the pie chart shows the total annual heat loss.
Window Display
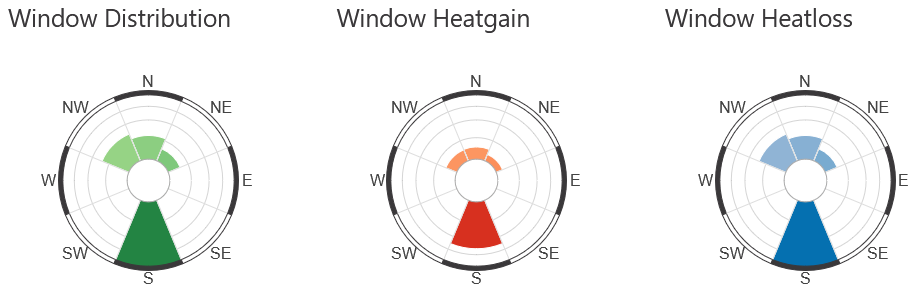
- The Window Distribution graph shows the total window orientation distribution for the house.
- Mousing over each piece of the pie will give addition information on the windows including area and % of overall glazing.
- Window orientation has significant impact on TEDI.
- South facing glazing typically improves your TEDI but runs the risk of overheating and increasing the cooling load if there is improper overhang design, improper SHGC, or improper ventilation in the rooms with lots of glazing.
- North facing glazing typically negatively impacts TEDI.
- The Window Heatgain and Window Heatloss graphs display the distribution of heat transfer through the windows of the house.
- Houses with lots of North facing glazing may need a combination of thermal upgrades to improve TEDI.
- Increasing the SHGC can reduce the heating load but will increase the need for cooling.
Air Leakage Comparison

- Air leakage is the only metric that EAs can input into Hot2000.
- This graph compares NLA, NRL, and ACH and converts them to ACH.
- The black dotted line represents the Base House.
- Mousing over the bar graphs will display the ACH equivalent for each air tightness metric for the corresponding Step.
Yearly Thermal Loads
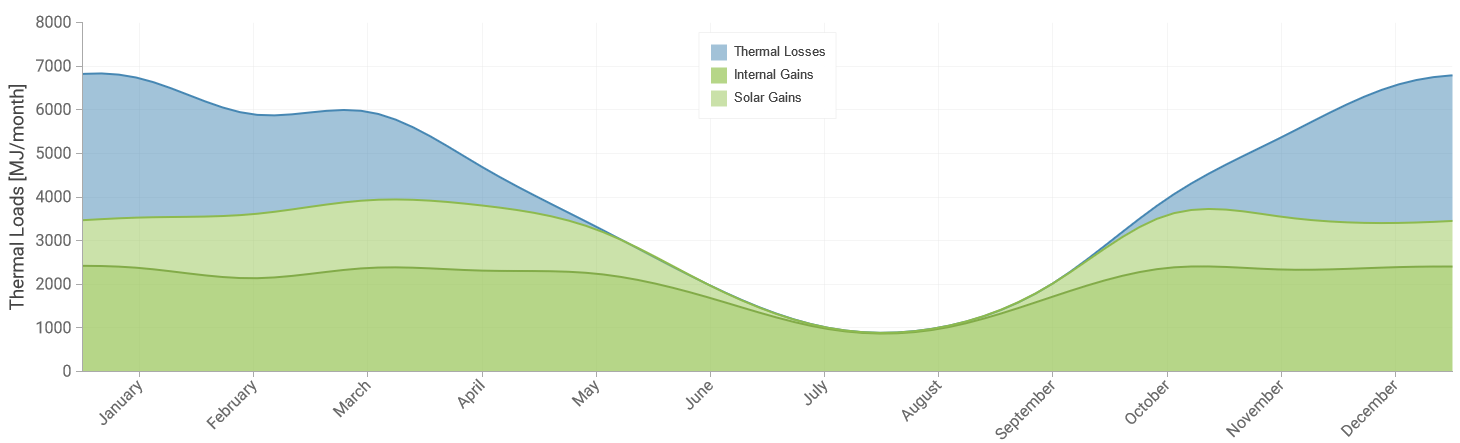
- This graph displays the modeled thermal loads of the house over a period of 1 year.
- Improving envelope performance typically includes increasing solar gains, increasing internal gains, decreasing thermal losses, or a combination of all 3.